Data-driven modeling in Dark Matter search.
Summary
SuperCDMS is an experiment to detect dark matter directly. It relies on accurate measurements of energy and position of particle interactions in its low temperature semiconductor detectors. In the recent past there has been a significant motivation to look for lower energy dark matter particle candidates. With this in view, SuperCDMS has been running a low-mass dark matter experiment based on a clever modification of the detectors that allows to operate them at higher electric field in and gain better sensitivity CDMSlite 2016 paper. A data quality selection for the good operating region (a fiducial volume) was determined to remove regions with excessive noise. A data-driven modeling approach was used which helped to achieve very good results for the same.
Some background
A phenomena called the Neganov-Luke effect is used for signal amplification in SuperCDMS particle detectors. Electric field used to drift charge carriers inside semiconductor crystal is fully converted into phonons (lattice vibrations). The signal intensity is thus dependent on the number of charge carriers and the voltage drop across the crystal. This has been used to increase signal amplification to look for low mass dark matter particles in the CDMS Low Ionization Threshold Experiment (CDMSlite). Due to a distortion in the electric field on one side of the detector several events (particle interactions in the detector) experience a reduced voltage drop and hence a reduced signal amplification. This leads to a distortion of the particle spectrum and hence create a background (noise) for the experiment. These background (noise) events being indistinguishable from true events one needs to find other ways to remove them.
Data driven modeling and specification of good detector region
The distribution of these background events was estimated at different radii and different energies statistically using a clever strategy and then a suitable limiting radius was decided to specify the good region and only events inside the good region were accepted for the experiment. This lead to a significant improvement in the sensitivity of the experiment.
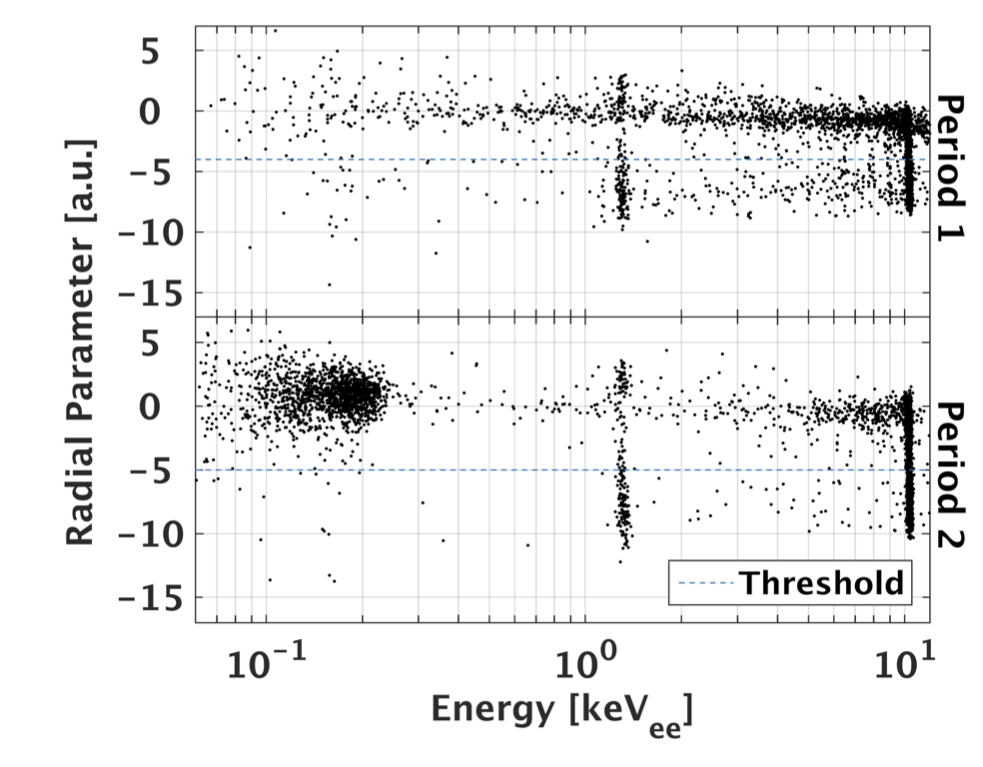
The clever strategy was to map the distribution of events from an activation line in Germanium. Figure.1 shows the distribution of events in the radius vs energy plane with the activation lines at about 10 and 1 keV. The events in the activation lines decreases exponentially over time as the number of active nuclei decreases obeying the decay law. Hence a time domain maximum likelihood estimation of two different signal amplitudes was carried out, one that decays exponentially with time and another that remains constant. Of course the part that decays is not of interest to the experiment and can be either omitted or accounted for statistically. However, these activation line events being homogenous inside the detector volume allow us to probe the field geometry in the detector and hence model the detector response at all places in the detector.
 |
|---|
| Figure.1: Distribution of events in the radius vs energy plane for two separate periods the experiment ran. Activation lines can be seen at 1 and 10 keV. The smearing of these lines due to the distortion in the electric field can be seen at high radii. Source: CDMSlite 2016 paper |
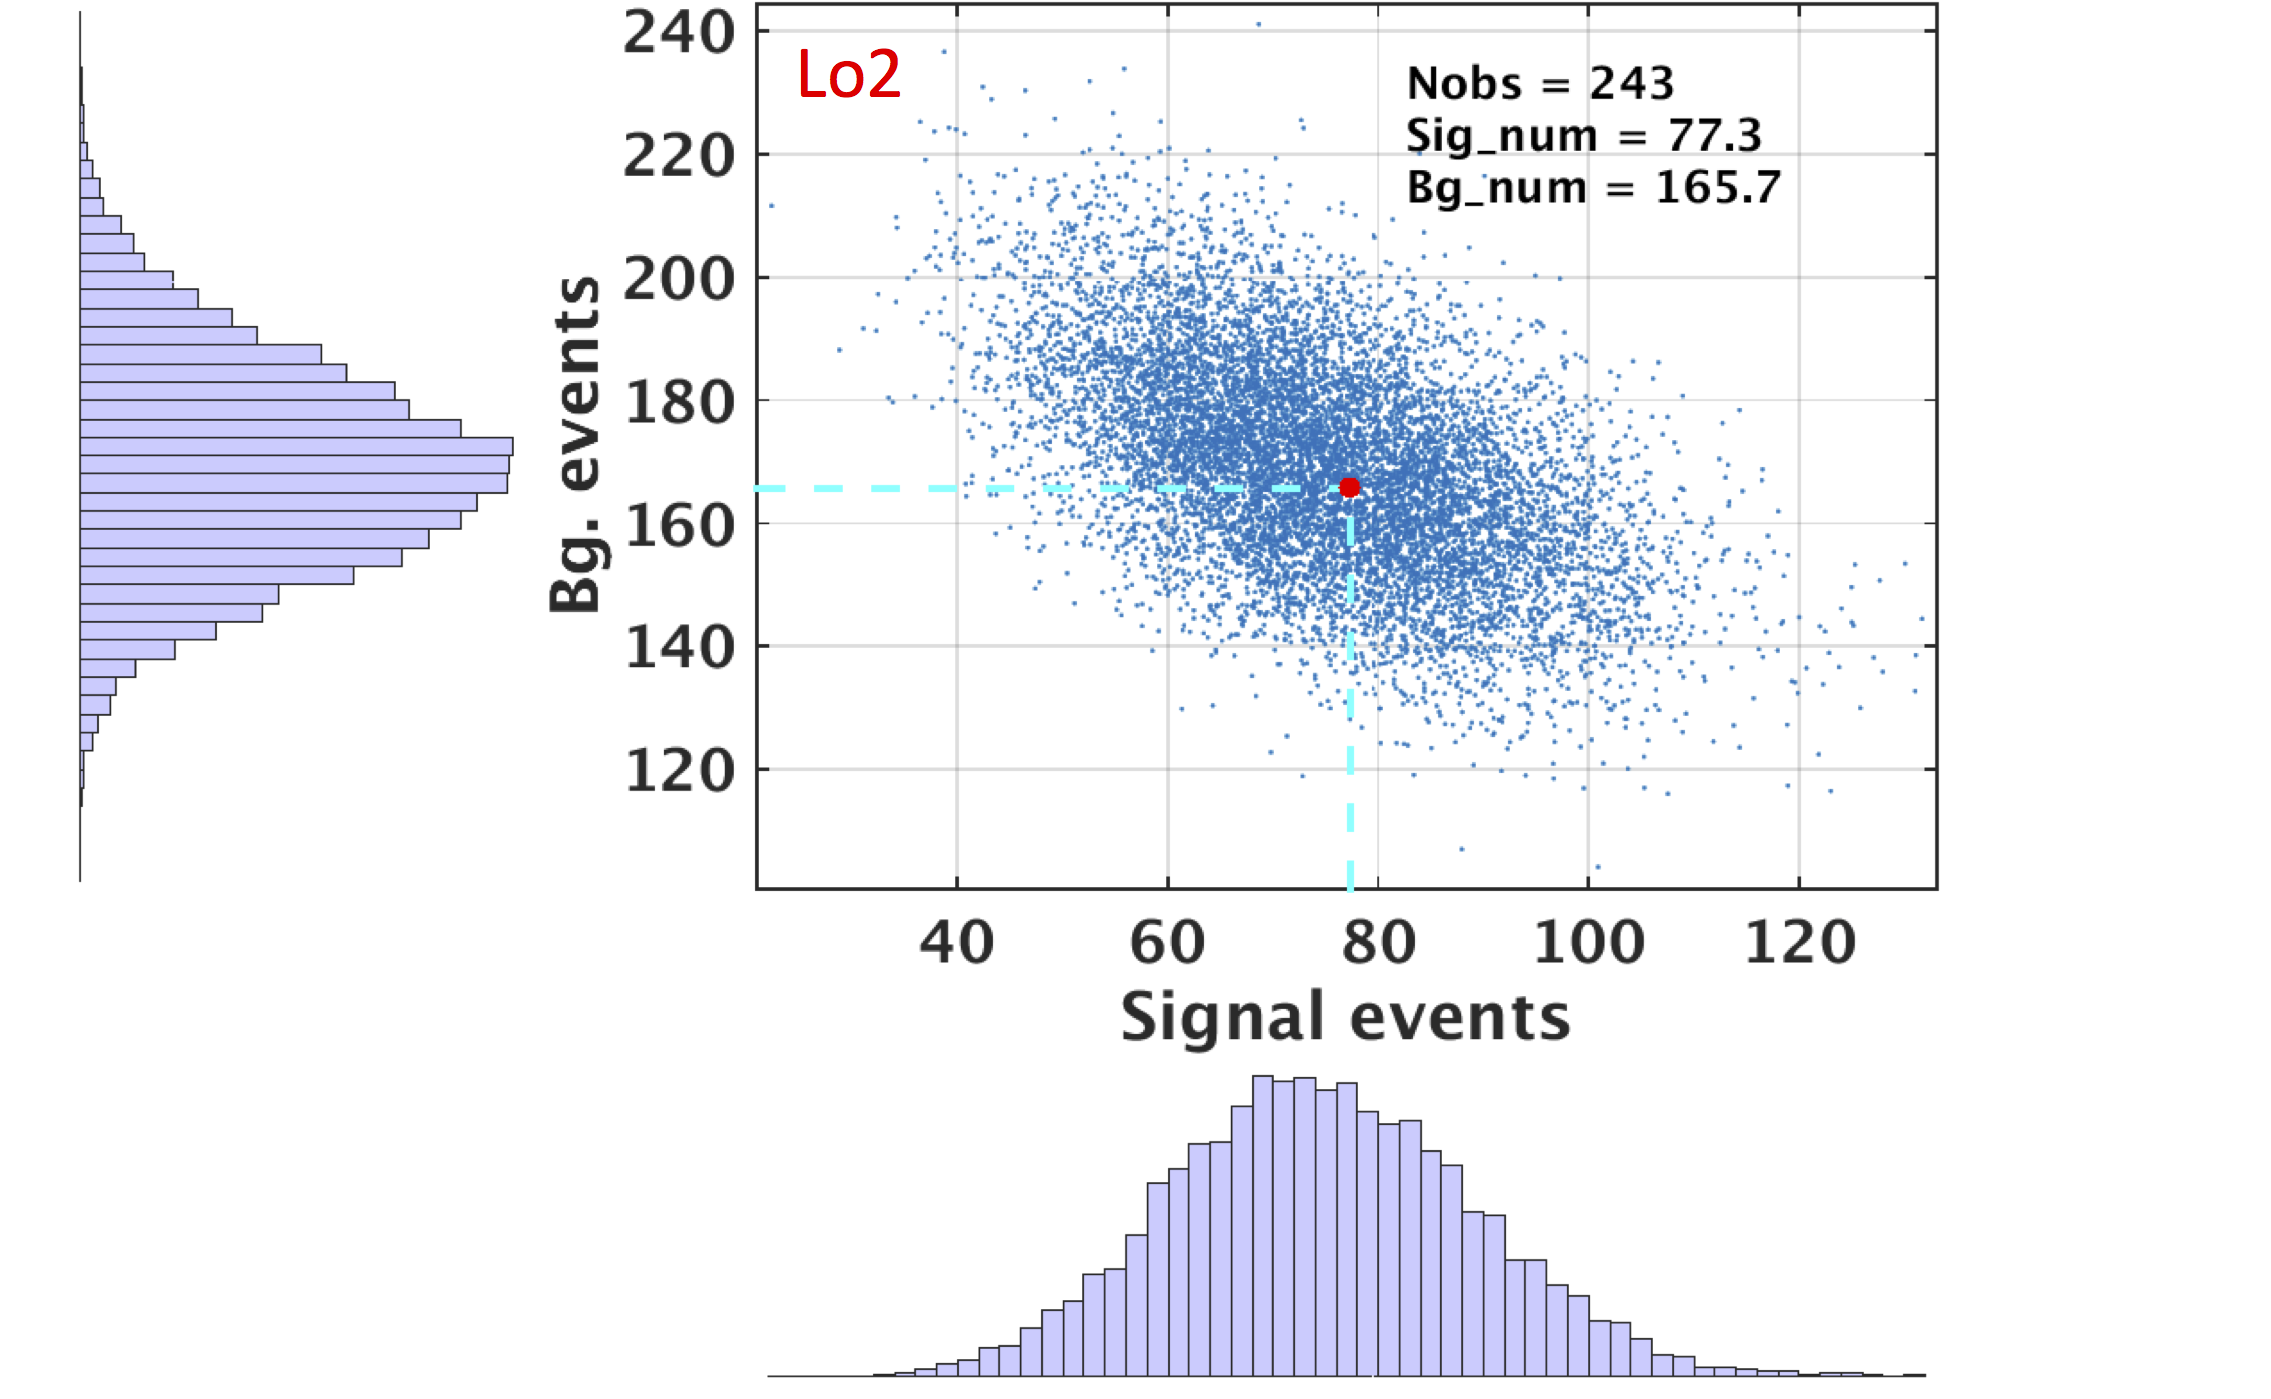
Maximum likelihood estimation was used along with Monte Carlo simulations to generate central values and error bounds for carefully designed bins in the energy vs radius plane. This generated distributions like the one shown in figure.2. A limit was placed on the radius based on the amplitudes of the activation line in these different bins.
 |
|---|
| Figure.2: An example of the distribution generated by Monte Carlo simulations using the likelihood function for a particular 2 dimensional bin in radius vs energy plane. This allowed extraction of central values and error bounds. |
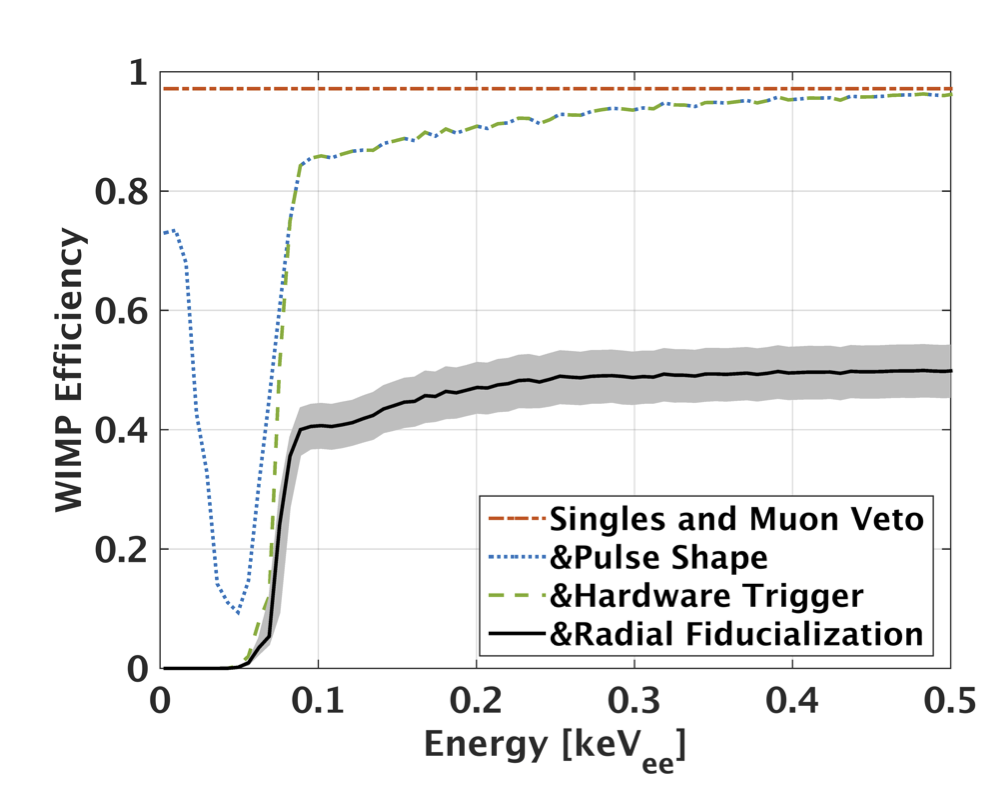
Further work involved computing the efficiency of such a selection, i.e. the fraction of events retained at every energy. This fraction is possibly dependent on energy due to variation of pulse shape with energy and since the radius estimator relies on pulse shape. The calculation this efficiency was carried out with a combination of simulations and calculations based on the detector response determined earlier. This lead to a WIMP (dark matter candidate) acceptance efficiency as shown by the black line in the figure.3. Note that the black line with the grey contours includes the acceptance efficiencies of all other selections criteria.
 |
|---|
| Figure.3: WIMP acceptance efficiency after sequential application of various selection criteria. The black line with grey contours is the final acceptance efficiency including the radial selection criteria.Source: CDMSlite 2016 paper |
This is described in more detail in the CDMSlite 2016 paper. This project was carried out at Queen’s university along with members of the SuperCDMS research group.